Transport Funding Cuts 2024
A recent article in the Waikato Times raised concerns about a $100 million transport funding shortfall for the Waikato region, with $20 million cut from Waikato District’s budget.
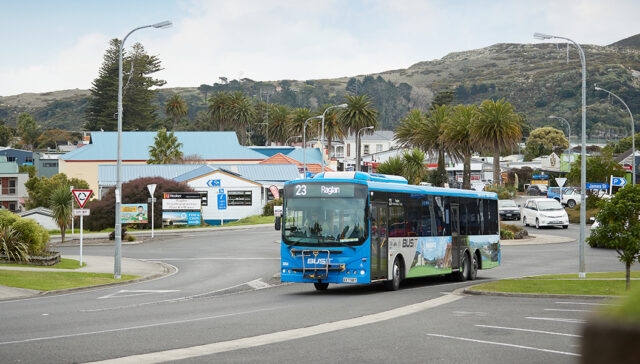
Transport in Whaingaroa looks very car dominated, with only 96 of 1,185 Raglan travel to work journeys on census day 2013 made by bike, bus, or walking. In Te Uku it was 15 out of 969. Despite those figures, Council believes people walk and cycle more than elsewhere in the district. Parking has long been perceived as a problem, as has the single lane bridge. There are 4 Hamilton buses a day, a community bus and buses serving Raglan, TeUku, Waitetuna and TeMata schools. They carry about 2% of travellers. Raglan differs from most of the region in being a destination rather than a place on the way to somewhere else. Therefore it doesn’t figure highly in regional plans. As a tourism hub we endure high levels of frustration due to capacity, especially in the summer peak. The Infrastructure and Transport chapters of the 2001 Raglan Naturally plan didn’t look at climate change, but had proposals to improve transport, including free buses to the beaches and more to Hamilton, ferries, bike paths, a village square, a CBD mall with service lanes, traffic calming on SH23 from Greenslade Rd and upgrading Wainui Rd footpath. A more mobile and growing population has seen average daily traffic numbers, as measured on the main road near Wright’s Rd, increase from 2,850 in 2000 to 4,758 in 2016. The numbers on the Raglan-Hamilton buses have risen even faster, accounting for overcrowding (22 times in 2016) and the need to run an 85-seat double decker on some journeys. Passengers have increased from 24,392 a year in 2003 to 63,571 in 2017. In that time the main road has been widened in a couple of places to provide for overtaking, an extra midday bus has been added, weekend buses restored and the peak services are now run by 2 buses, plus a smaller bus providing relief between Whatawhata and Hamilton. Parking has been increased at the wharf, at the corner of Wallis/Bow St and on Bankart St, Wallis St and James St (57 spaces in 2014 as part of a $448,939 upgrade). It has not reduced calls for more parking. The boat ramp asset assessment suggested a user pay system for non ratepayers. CBD parking ranked high in the list of Raglan priorities in 2014. However, in the 1999 RN survey, 53% supported car parks funded by users, but only 26% supported funding from rates. For some time the area behind the corrugated iron in Wi Neera St was advertised for parking at $10 a week, but very few took it up. That suggests users are not willing to pay for additional parking and, if a large majority still believe in user-pays, extra on-road parking is not needed. Length of stay has also been controversial; the longer the time permitted, the fewer can use spaces at peak times. Some 1 hour limits on Bow St are to be raised to 2 hour. Raglan Club (for a fee) & Rugby Club have large car parks available, but, as the Google map shows, often have many vacant spaces. A recent article in the Waikato Times raised concerns about a $100 million transport funding shortfall for the Waikato region, with $20 million cut from Waikato District’s budget. Having undergone significant work over the past year, the completion of Raglan’s Town2Surf cycleway is on the horizon, providing locals and visitors alike with a safe place to walk, run and cycle. To provide for people and goods to get about in ways which help provide worthwhile jobs, minimise impact on the environment and other activities, promote equal access to transport, whatever age, state of health, or wealth, and improve health and safety. To achieve this: They also attract tourists in a manner which minimises their adverse impacts on the area. Buses are supported; they provide transport for all, complement walking and cycling and are safer and need less space and fuel than cars. Get people out of their cars and see major benefits on issues like health and parking. Build a cycleway/walkway from town to Manu Bay. This road is getting used more and more this road and becoming very dangerous. Getting people out of their cars will have major benefits on issues such as parking and health.
Transport
Ngā Waka
Groups & Organisations
Projects
Learn
Get Involved
Stories
Transport Funding Cuts 2024
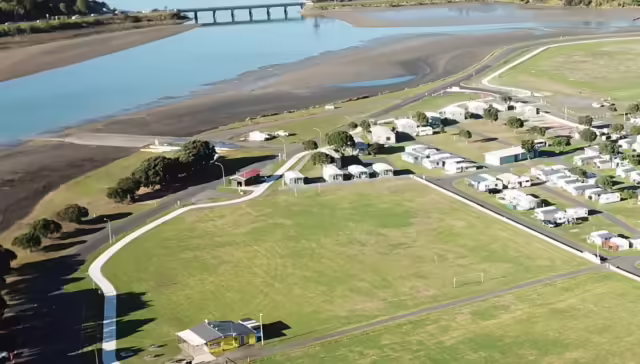
Walk, run or cycle: Raglan’s Town2Surf cycleway takes another step towards completion
Aspirations
Walking and cycling are supported; they provide transport solutions, have a low impact on the environment and encourage exercise to improve health.
Most common themes from the community
More cycling
Route to coast for cycling/walking
Town square/pedestrianise CBD
More footpaths
More (or less) parking
Shuttle bus around Raglan
More country walking
Reduce traffic speeds
More buses
Upgrade Single Lane Bridge (some to keep, some to widen)
Possible pathways toward achieving these aspirations